When I served as a camp director for a mid-sized summer camp in east-central Nebraska, weather ranked among my greatest concerns for camper and staff safety. In the middle of the country, we saw some wild weather: thunderstorms, hail, lightning, tornadoes, and torrential rain. But dangerous weather threats also arrived on sunny, hot, and humid days.
The US Centers for Disease Control and Prevention and the National Weather Service identify heat as the greatest weather-related cause of death. Why are heat waves so dangerous? Many factors come into play, but the biggest reason is that they are largely inescapable. Everyone in the area faces constant exposure to high heat and humidity, which puts them in immediate danger of experiencing dehydration and heat exhaustion — especially those who work, learn, play, live, and sleep outside. This includes our campers and staff, especially if they don’t sleep in air-conditioned spaces. Heat stress is exacerbated by days of back-to-back high temperatures with high humidity.
The human body can acclimate to high temperatures and high humidity, but adaptation takes time (eight to fourteen days or longer). If the young people attending our camps are used to spending their summers in air-conditioned comfort, then a few days of exposure to very hot, humid weather may not provide enough time for them to adapt. As a result, those campers are at greater risk for heat-related illness.
What tools do camp directors have to anticipate dangerous heat conditions? The first and most primitive tool is the thermometer, which measures only the temperature. As anyone who has experienced 90-degree or warmer temperatures in Houston, Texas, versus Phoenix, Arizona, will recognize, temperature is only one factor in heat discomfort. A second factor is humidity, and the heat index combines both the temperature and humidity to produce a “feels-like” temperature reading that in very humid conditions is higher than the actual temperature. Heat index temperatures are a better indicator of heat stress in humid areas than temperature alone, but this only addresses what conditions are like in the shade. Since much of campers’ summertime activities are outdoors, often in direct sunshine, an even better predictor of heat danger is the wet bulb globe temperature (WBGT), which combines temperature, humidity, sun angle, and sky cover with wind speed to predict heat danger.
WBGT is well suited for use in protecting outdoor workers, athletes, campers and camp staff, and others performing strenuous outdoor activities. In fact, WBGT is called “the gold standard for assessing environmental heat stress during physical activity” (Cooper et al., 2017).
WBGT is a combination of three measurements:
- Air temperature — measured by a typical outdoor thermometer.
- Natural wet bulb temperature — measured by a thermometer wrapped in a wet cloth, which simulates the cooling effect of sweat (which is influenced by wind and humidity). Since the thermometer is exposed to the sun, it also accounts for the effects of sunlight.
- Black globe temperature — measured with a thermometer inside a black globe, which indicates how hot it feels in direct sunlight.
The formula to calculate WBGT is: (10 percent of air temperature) + (70 percent of natural web bulb temperature) + (20 percent of black globe temperature) = WBGT (Nicholas Institute for Energy, Environment & Sustainability, 2023). Fortunately, devices exist to handle these measurements and calculations.
The most common way of measuring WBGT is with handheld meters. Factors like wind and humidity vary significantly across small distances. When using this method to determine if outdoor activity is safe, it is important that accurate WBGT measurements be recorded at the site of activity. WBGT can change rapidly, so frequent monitoring is required to provide the best protection for those outside in extreme conditions. This can mean assessing WBGT every 30 minutes.
Table 1 illustrates the comparison in measurement factors between WBGT and heat index.
Table 1. How Does WBGT Differ from Heat Index?
|
Wet Bulb Globe Temperature (WBGT) WBGT estimates the effect of temperature, relative humidity, wind and solar radiation on humans. Heat Index The traditional measure of what the temperature feels like to the human body when relative humidity is combined with air temperature. |
Factors |
WBGT |
Heat Index |
|
Measured in the sun |
x |
|
|
|
Measured in the shade |
|
x |
|
|
Uses temperature |
x |
x |
|
|
Uses relative humidity |
x |
x |
|
|
Uses wind |
x |
|
|
|
Uses cloud cover |
x |
|
|
|
Uses sun angle |
x |
|
(National Weather Service, n.d.)
The differences between the measurements of temperature, heat index, and WBGT are illustrated in Table 2. Notice particularly the impact wind speed and sky cover have on WBGT, and how heat index does not vary because temperature, dew point, and relative humidity remain static despite changes in sky cover and wind speeds.
Table 2. Impact of Measurement Differences
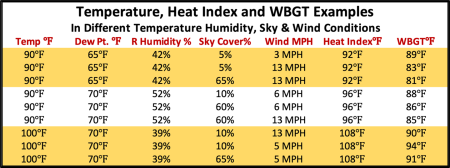
(National Weather Service, n.d.)
Due to geographic variations in heat exposure and acclimatization, lower heat safety thresholds may be needed in areas with cooler climates. A study of heat illness among US soldiers found that soldiers from northern states, presumed to have lower degrees of acclimatization, had considerably greater rates of exertional heat illness than those from southern states (Carter et al., 2005). Researchers have developed three heat safety regions in the United States based on local extreme weather conditions. The three regions help determine the point at which WBGT rises to dangerous levels.
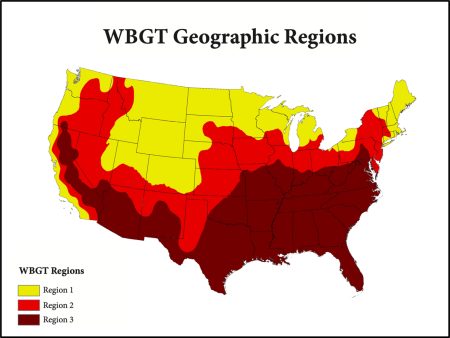
(Grundstein et al., 2015)
For each region, the level at which WBGT becomes hazardous varies, and localized resources are often available to provide guidance to camp administrators. For example, the Nebraska School Activities Association provides WBGT guidelines for Regions 1 and 2, as large areas of the state fall in each region. The North Carolina High School Athletic Association provides guidelines for a state in the heart of Region 3. Your own state may have similar guidelines available from a state school activities association or nearby school district.
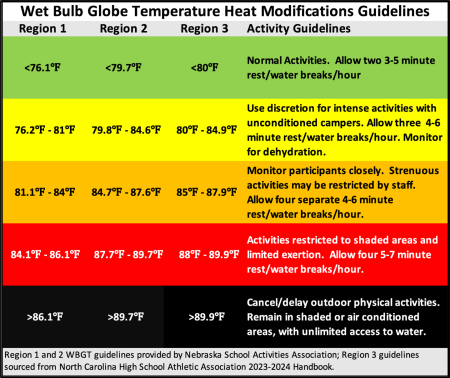
Recommendations (the author’s) for activity modifications or restrictions appear in Table 3. They are based on examination of standards for restrictions for high school aged athletes in the three WBGT regions and are for those camp activities involving physical exertion, such as navigating a ropes course, canoeing, row boating, or hiking. Activities that are more sedentary, such as handicraft or classroom-like programming, where participants are sitting in shaded areas can be continued. Camp staff should monitor participants in these more sedentary programs for signs of dehydration, especially if movement between program areas involves long walks in sunshine when program activities change throughout the day.
Table 3. Activity Modification Guidelines
The National Weather Service currently provides wet bulb globe temperature forecasts as an unofficial prototype. Contact your local National Weather Service office to see if it produces a localized WBGT forecast for its service area. A localized forecast of WBGT can help camp leaders determine when more careful real-time monitoring may be necessary.
Handheld WBGT measuring devices are available for purchase, ranging from less than $100 to several hundred dollars. Some weather station devices like the Tempest weather station can be permanently mounted. This device provides measures of temperature, humidity, wind speed, lightning strike detection and distance, and rainfall. It also provides WBGT. Handheld devices can be convenient for use in separate program areas with high levels of exertion but with different exposures to sun, humidity, and wind.
During three hot and humid days in 2023, using WBGT thresholds recommended for Region 2, a total of six hours were logged when outdoor activities involving exertion would have been canceled or delayed. During the same three days, an additional two hours would have fallen into the restricted activity category. This compares to no hours of restricted, canceled, or delayed activity using the previous heat index-based threshold. As it turns out, these three days came after camp had concluded for the season, but these were days when the National Weather Service had issued excessive heat warnings, and dew points reached as high as 82 degrees Fahrenheit with relative humidity ranging from a high of 100 percent to a low of 62 percent. During that period, the highest recorded temperature was only 94 degrees Fahrenheit.
WBGT data can help camp directors keep their campers and camp staff safe in extreme temperature and humidity conditions — and make bright, sunny days a little less threatening.
Photo courtesy of Camp Tawonga, Groveland, CA.
References
Carter, R., Cheuvront, S. N., Williams, J. O., Kolka, M. A., Stephenson, L. A., Sawka, M. N., & Amoroso, P. J. (2005). Epidemiology of hospitalizations and deaths from heat illness in soldiers. Medicine & Science in Sports & Exercise, 37(8), 1338e–1344.
Cooper, E., Grundstein, A., Rosen, A., Miles, J., Ko, J., & Curry, P. (2017, December 1). An evaluation of portable wet bulb globe temperature monitor accuracy. Journal of Athletic Training. 52 (12): 1161–1167.
Grundstein, A., Williams, C., Phan, M., & Cooper, E. (2015, January). Regional heat safety thresholds for athletics in the contiguous United States. Applied Geography, 56, 55–60. doi.org/10.1016/j.apgeog.2014.10.014
National Weather Service. (n.d.). WetBulb Globe Temperature. weather.gov/tsa/wbgt
Nicholas Institute for Energy, Environment & Sustainability. (2023). What is wet bulb globe temperature (WBGT)? Duke. nicholasinstitute.duke.edu/project/heat-policy-innovation-hub/what-is-wet-bulb-globe-temperature-wbgt
Ralph L. Morocco, Jr. is a retired camp director of Camp Cedars, a Boy Scout camp in Nebraska.


